Introduction
Mastering machine learning algorithms
isn’t a myth at all. Most of the beginners start by learning regression.
It is simple to learn and use, but does that solve our purpose? Of
course not! Because, you can do so much more than just Regression!
Think of machine learning algorithms as
an armory packed with axes, sword, blades, bow, dagger etc. You have
various tools, but you ought to learn to use them at the right time. As
an analogy, think of ‘Regression’ as a sword capable of slicing and
dicing data efficiently, but incapable of dealing with highly complex
data. On the contrary, ‘Support Vector Machines’ is like a sharp knife –
it works on smaller datasets, but on them, it can be much more stronger
and powerful in building models.
By now, I hope you’ve now mastered Random Forest, Naive Bayes Algorithm and Ensemble Modeling.
If not, I’d suggest you to take out few minutes and read about them as
well. In this article, I shall guide you through the basics to advanced
knowledge of a crucial machine learning algorithm, support vector
machines.

Table of Contents
- What is Support Vector Machine?
- How does it work?
- How to implement SVM in Python?
- How to tune Parameters of SVM?
- Pros and Cons associated with SVM
What is Support Vector Machine?
“Support Vector Machine” (SVM) is a
supervised machine learning algorithm which can be used for both
classification or regression challenges. However, it is mostly
used in classification problems. In this algorithm, we plot each data
item as a point in n-dimensional space (where n is number of features
you have) with the value of each feature being the value of a particular
coordinate. Then, we perform classification by finding the hyper-plane
that differentiate the two classes very well (look at the below
snapshot).
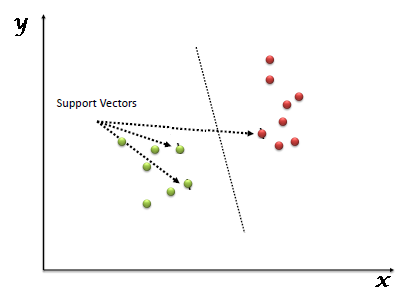
Support Vectors are simply the
co-ordinates of individual observation. Support Vector Machine is a
frontier which best segregates the two classes (hyper-plane/ line).
You can look at definition of support vectors and a few examples of its working here.How does it work?
Above, we got accustomed to the process
of segregating the two classes with a hyper-plane. Now the burning
question is “How can we identify the right hyper-plane?”. Don’t worry,
it’s not as hard as you think!
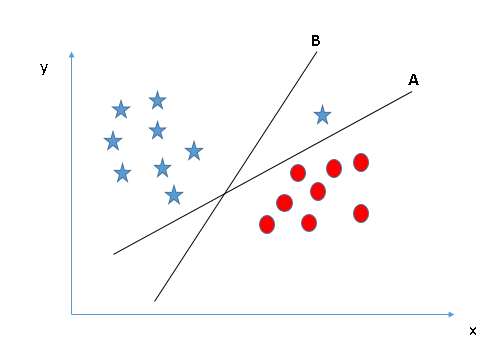
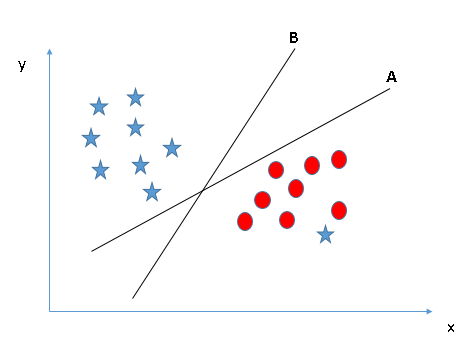
Let’s understand:- Identify the right hyper-plane (Scenario-1): Here, we have three hyper-planes (A, B and C). Now, identify the right hyper-plane to classify star and circle.
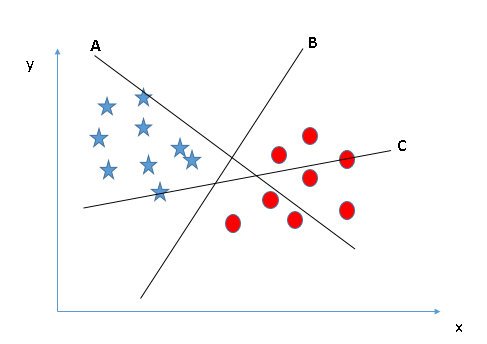 You
need to remember a thumb rule to identify the right hyper-plane:
“Select the hyper-plane which segregates the two classes better”. In
this scenario, hyper-plane “B” has excellently performed this job.
You
need to remember a thumb rule to identify the right hyper-plane:
“Select the hyper-plane which segregates the two classes better”. In
this scenario, hyper-plane “B” has excellently performed this job. - Identify the right hyper-plane (Scenario-2): Here,
we have three hyper-planes (A, B and C) and all are segregating the
classes well. Now, How can we identify the right hyper-plane?
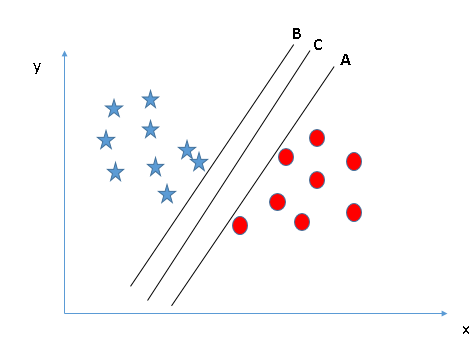 Here,
maximizing the distances between nearest data point (either class) and
hyper-plane will help us to decide the right hyper-plane. This distance
is called as Margin. Let’s look at the below snapshot:
Here,
maximizing the distances between nearest data point (either class) and
hyper-plane will help us to decide the right hyper-plane. This distance
is called as Margin. Let’s look at the below snapshot: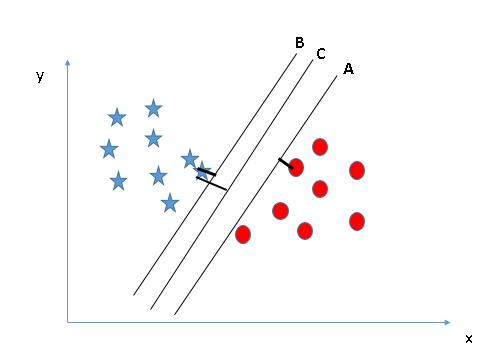
Above, you can see that the margin for hyper-plane C is high as compared to both A and B. Hence, we name the right hyper-plane as C. Another lightning reason for selecting the hyper-plane with higher margin is robustness. If we select a hyper-plane having low margin then there is high chance of miss-classification. - Identify the right hyper-plane (Scenario-3):Hint: Use the rules as discussed in previous section to identify the right hyper-plane
 Some of you may have selected the hyper-plane B as it has higher margin compared to A. But,
here is the catch, SVM selects the hyper-plane which classifies the
classes accurately prior to maximizing margin. Here, hyper-plane B has a
classification error and A has classified all correctly. Therefore,
the right hyper-plane is A.
Some of you may have selected the hyper-plane B as it has higher margin compared to A. But,
here is the catch, SVM selects the hyper-plane which classifies the
classes accurately prior to maximizing margin. Here, hyper-plane B has a
classification error and A has classified all correctly. Therefore,
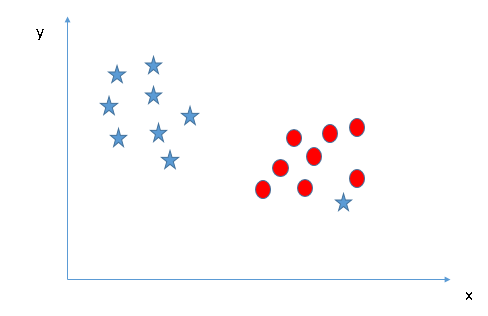
the right hyper-plane is A.- Can we classify two classes (Scenario-4)?: Below,
I am unable to segregate the two classes using a straight line, as one
of star lies in the territory of other(circle) class as an outlier.
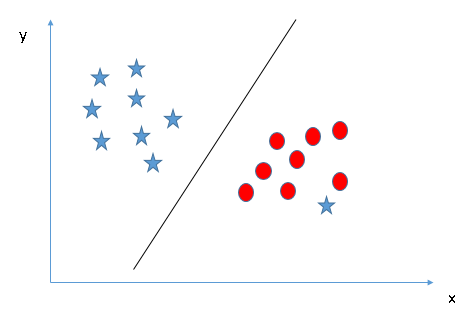
 As
I have already mentioned, one star at other end is like an outlier for
star class. SVM has a feature to ignore outliers and find the
hyper-plane that has maximum margin. Hence, we can say, SVM is robust to
outliers.
As
I have already mentioned, one star at other end is like an outlier for
star class. SVM has a feature to ignore outliers and find the
hyper-plane that has maximum margin. Hence, we can say, SVM is robust to
outliers.
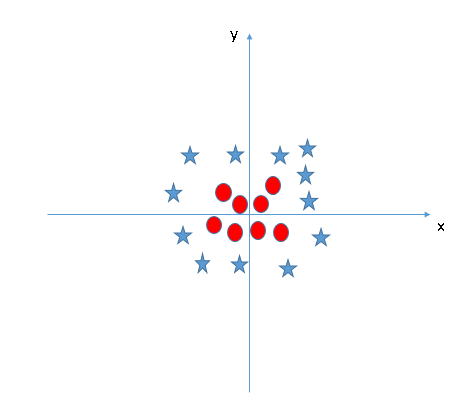
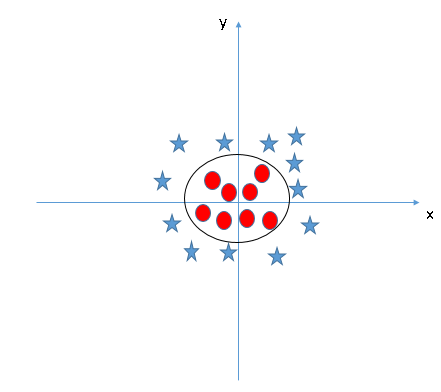
- Find the hyper-plane to segregate to classes (Scenario-5): In
the scenario below, we can’t have linear hyper-plane between the two
classes, so how does SVM classify these two classes? Till now, we have
only looked at the linear hyper-plane.
 SVM
can solve this problem. Easily! It solves this problem by
introducing additional feature. Here, we will add a new feature
z=x^2+y^2. Now, let’s plot the data points on axis x and z:
SVM
can solve this problem. Easily! It solves this problem by
introducing additional feature. Here, we will add a new feature
z=x^2+y^2. Now, let’s plot the data points on axis x and z:
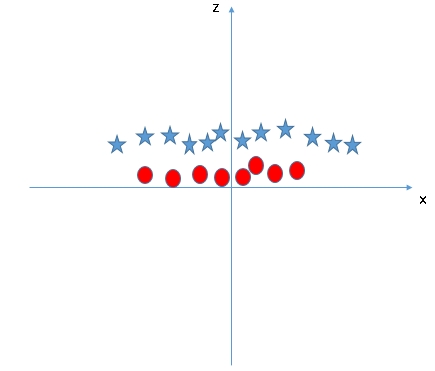
In above plot, points to consider are:- All values for z would be positive always because z is the squared sum of both x and y
- In the original plot, red circles appear close to the origin of x and y axes, leading to lower value of z and star relatively away from the origin result to higher value of z.
When we look at the hyper-plane in original input space it looks like a circle:
How to implement SVM in Python?
In Python, scikit-learn is a widely used library for implementing machine learning algorithms, SVM is also available in scikit-learn library and follow the same structure (Import library, object creation, fitting model and prediction). Let’s look at the below code:#Import Library from sklearn import svm #Assumed you have, X (predictor) and Y (target) for training data set and x_test(predictor) of test_dataset # Create SVM classification object model = svm.svc(kernel='linear', c=1, gamma=1) # there is various option associated with it, like changing kernel, gamma and C value. Will discuss more # about it in next section.Train the model using the training sets and check score model.fit(X, y) model.score(X, y) #Predict Output predicted= model.predict(x_test)
How to tune Parameters of SVM?
Tuning parameters value for machine learning algorithms effectively improves the model performance. Let’s look at the list of parameters available with SVM.sklearn.svm.SVC(C=1.0, kernel='rbf', degree=3, gamma=0.0, coef0=0.0, shrinking=True, probability=False,tol=0.001, cache_size=200, class_weight=None, verbose=False, max_iter=-1, random_state=None)I am going to discuss about some important parameters having higher impact on model performance, “kernel”, “gamma” and “C”.
kernel: We have already
discussed about it. Here, we have various options available with kernel
like, “linear”, “rbf”,”poly” and others (default value is “rbf”). Here
“rbf” and “poly” are useful for non-linear hyper-plane. Let’s look at
the example, where we’ve used linear kernel on two feature of iris data
set to classify their class.
Example: Have linear kernel
import numpy as np
import matplotlib.pyplot as plt
from sklearn import svm, datasets
# import some data to play with
iris = datasets.load_iris()
X = iris.data[:, :2] # we only take the first two features. We could
 # avoid this ugly slicing by using a two-dim dataset
y = iris.target
# we create an instance of SVM and fit out data. We do not scale our
# data since we want to plot the support vectors
C = 1.0 # SVM regularization parameter
svc = svm.SVC(kernel='linear', C=1,gamma=0).fit(X, y)
# create a mesh to plot in
x_min, x_max = X[:, 0].min() - 1, X[:, 0].max() + 1
y_min, y_max = X[:, 1].min() - 1, X[:, 1].max() + 1
h = (x_max / x_min)/100
xx, yy = np.meshgrid(np.arange(x_min, x_max, h),
 np.arange(y_min, y_max, h))
plt.subplot(1, 1, 1)
Z = svc.predict(np.c_[xx.ravel(), yy.ravel()])
Z = Z.reshape(xx.shape)
plt.contourf(xx, yy, Z, cmap=plt.cm.Paired, alpha=0.8)
plt.scatter(X[:, 0], X[:, 1], c=y, cmap=plt.cm.Paired)
plt.xlabel('Sepal length')
plt.ylabel('Sepal width')
plt.xlim(xx.min(), xx.max())
plt.title('SVC with linear kernel')
plt.show()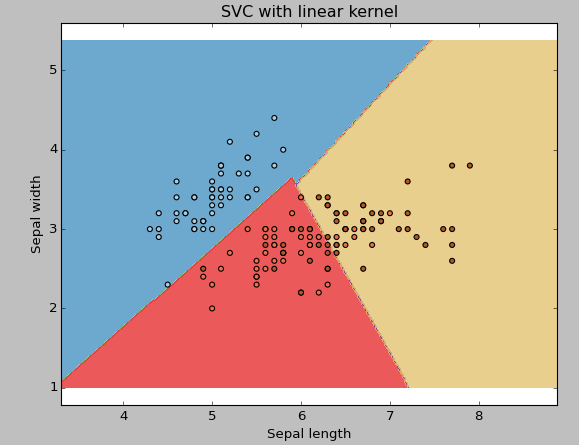
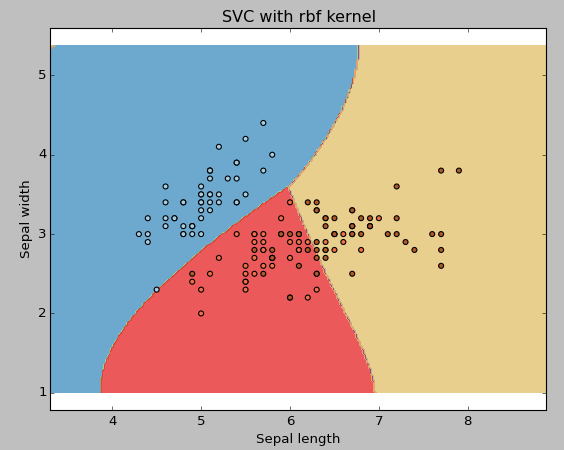
Example: Have rbf kernelChange the kernel type to rbf in below line and look at the impact.
svc = svm.SVC(kernel='rbf', C=1,gamma=0).fit(X, y)
I would suggest you to go for linear
kernel if you have large number of features (>1000) because it is
more likely that the data is linearly separable in high dimensional
space. Also, you can RBF but do not forget to cross validate for its
parameters as to avoid over-fitting.
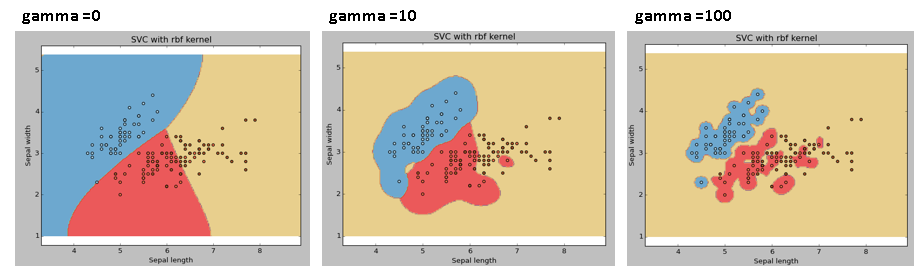
gamma: Kernel
coefficient for ‘rbf’, ‘poly’ and ‘sigmoid’. Higher the value of gamma,
will try to exact fit the as per training data set i.e. generalization
error and cause over-fitting problem.
Example: Let’s difference if we have gamma different gamma values like 0, 10 or 100.
svc = svm.SVC(kernel='rbf', C=1,gamma=0).fit(X, y)
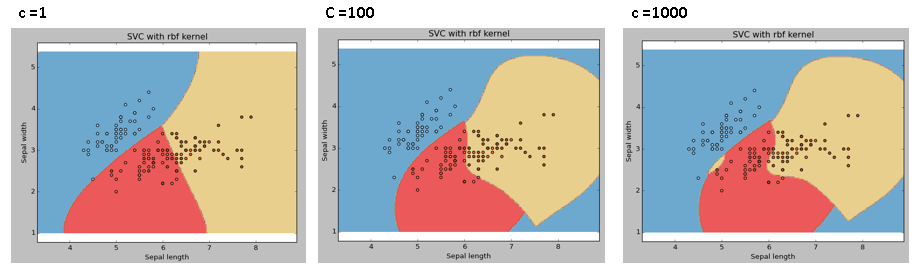
C: Penalty parameter C
of the error term. It also controls the trade off between smooth
decision boundary and classifying the training points correctly.
Pros and Cons associated with SVM
- Pros:
- It works really well with clear margin of separation
- It is effective in high dimensional spaces.
- It is effective in cases where number of dimensions is greater than the number of samples.
- It uses a subset of training points in the decision function (called support vectors), so it is also memory efficient.
- Cons:
- It doesn’t perform well, when we have large data set because the required training time is higher
- It also doesn’t perform very well, when the data set has more noise i.e. target classes are overlapping
- SVM doesn’t directly provide probability estimates, these are calculated using an expensive five-fold cross-validation. It is related SVC method of Python scikit-learn library.
Practice Problem
Find right additional feature to have a hyper-plane for segregating the classes in below snapshot: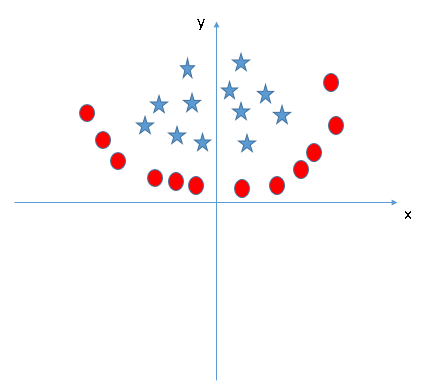
Answer the variable name in the comments section below. I’ll shall then reveal the answer.
End Notes
In this article, we looked at the
machine learning algorithm, Support Vector Machine in detail. I
discussed its concept of working, process of implementation in python,
the tricks to make the model efficient by tuning its parameters, Pros
and Cons, and finally a problem to solve. I would suggest you to use
SVM and analyse the power of this model by tuning the parameters. I also
want to hear your experience with SVM, how have you tuned parameters to
avoid over-fitting and reduce the training time?
Did you find this article helpful? Please share your opinions / thoughts in the comments section below.
No comments:
Post a Comment